Whole-Home Energy Monitoring: Track and Reduce Consumption
Whole-Home Energy Monitoring: Track and Reduce Consumption
Most homeowners have no idea what’s actually consuming power in their house. They see a monthly utility bill, maybe notice it climbed in August, and shrug. Smart home energy monitoring changes that dynamic completely. Instead of a single number at the end of the month, you get a live breakdown, circuit by circuit, sometimes appliance by appliance, showing exactly where your electricity goes and when.
That visibility has real financial consequences. Studies from Lawrence Berkeley National Laboratory have found that homes with detailed energy feedback reduce consumption by 5 to 15 percent on average, simply because awareness drives behavior change. Add automation to the picture, and that number climbs further. But the technology landscape is more complicated than it might appear, so before you buy anything, it’s worth understanding how these systems actually work.
How Whole-Home Energy Monitoring Works
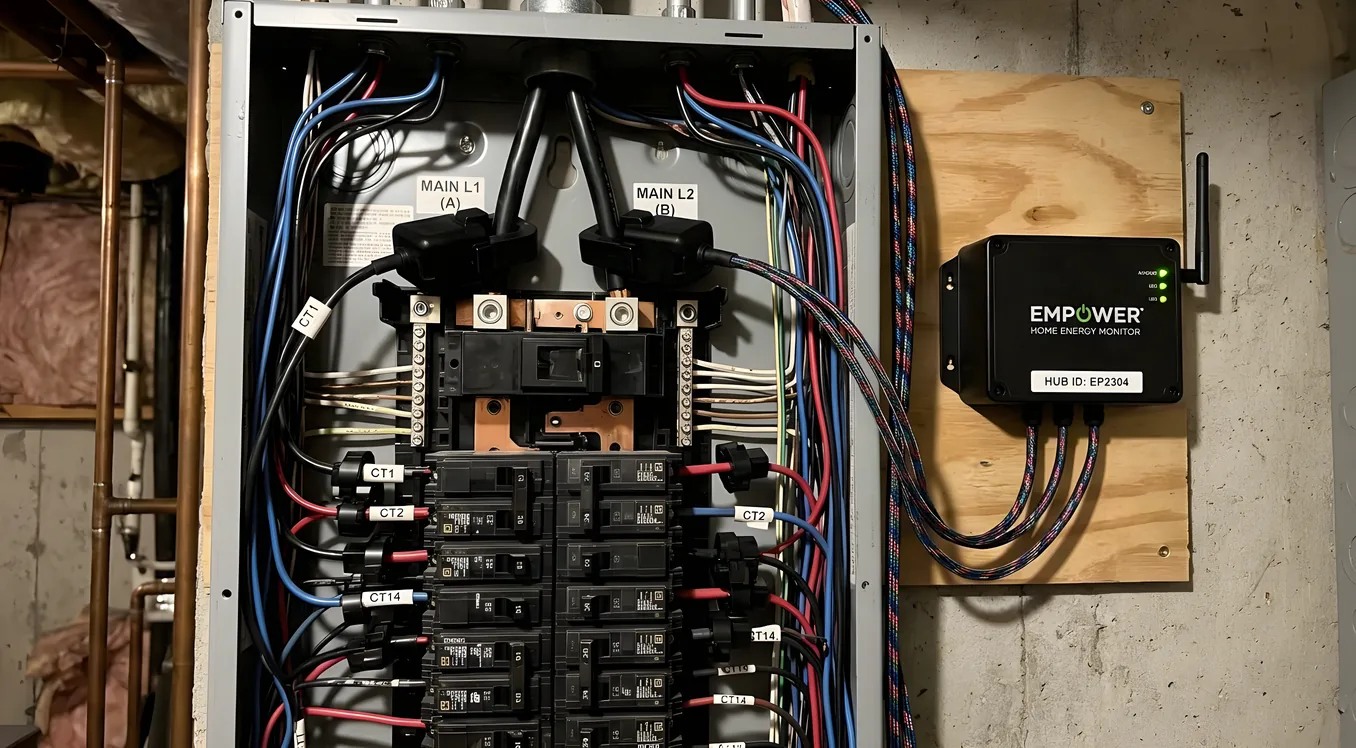
Your home’s electrical service enters through a main panel, typically a 200-amp breaker box. Everything in the house runs through that panel, split across individual circuits: one for the HVAC compressor, one for the kitchen outlets, one for the dryer, and so on.
Energy monitors work by clamping current transformers (CTs) around the conductors inside that panel. These are split-core sensors that measure the magnetic field produced by current flow without interrupting the circuit. The sensors feed data to a hub device, which calculates real-time wattage, tracks consumption over time, and transmits data to an app or automation platform.
The resolution of that monitoring, how granularly you can see what’s using power, depends on which approach you take.
Whole-panel monitoring uses two large CT sensors clamped around the main service conductors. You get a single aggregate number for the whole home’s consumption. This is useful for utility rate arbitrage and understanding peak demand, but it tells you nothing about individual circuits.
Per-circuit monitoring adds individual CTs to each breaker in the panel. A typical 40-circuit panel might require 30 to 40 sensors, each reporting independently. This gives you circuit-level data: you can see the dishwasher running its drying cycle, the EV charger pulling 7.2 kW overnight, and the refrigerator’s compressor cycling every 20 minutes.
Appliance-level disaggregation is a machine learning approach where a single whole-panel sensor uses consumption fingerprints to identify individual appliances. Sense is the best-known system using this approach. It works reasonably well for devices with distinctive electrical signatures (refrigerators, dishwashers, EV chargers), but it struggles with loads that have similar draw profiles.
The Major Systems Compared
Sense Energy Monitor
Sense is the most widely recognized DIY energy monitor, and it costs around $299 installed by an electrician (the unit itself is $299, professional installation typically adds $100 to $200). It uses two CTs on the main service conductors and relies on machine-learning pattern recognition to identify appliances over time.
The promise is appealing: one device, minimal wiring, appliance-level insight. The reality is more nuanced. Sense takes weeks to identify devices, and some appliances, particularly resistive loads like electric dryers and space heaters, never get cleanly detected because their signatures are too generic. The app is polished, the data is accessible, and integration with Philips Hue, Amazon Alexa, Google Home, and Home Assistant exists and works.
Where Sense falls short is precision. Aggregate current sensing with AI disaggregation is fundamentally a probabilistic method. You might see “Motor 1” and “Motor 2” instead of specific appliance names for months. If accurate circuit-level data is your goal, Sense’s approach has inherent limits.
Emporia Vue 2
The Emporia Vue 2 is what you choose when you want per-circuit monitoring at a reasonable price. The Vue 2 hub costs $139.99 and includes 16 50A CT sensors for individual circuits. If you need more circuits, the 200A expansion sensor kit adds whole-panel monitoring for $24.99, and additional CT sensors are available for larger panels.
Total installed cost for a 40-circuit home typically runs $200 to $400 in parts, plus electrician time. Unlike Sense, you’re getting actual per-circuit measurements. Every circuit you install a CT on reports real measured data, not inferred data.
Emporia’s app shows hourly, daily, monthly, and yearly breakdowns by circuit. Home Assistant integration via the Emporia integration or local MQTT is documented and works reliably. For homeowners who want to understand exactly which circuits are pulling what without relying on pattern recognition, Emporia Vue 2 is the strongest value in the market.
Iotawatt
Iotawatt is the system professional integrators and technically-oriented homeowners reach for when they want maximum accuracy and local processing. It supports up to 14 CT inputs per device, works entirely locally without a cloud dependency, and reports data via an open REST API that integrates with Home Assistant, InfluxDB, Grafana, and virtually anything else that can read JSON.
An Iotawatt unit with 14 CT sensors costs around $300. For a 42-circuit panel, you’d need three units networked together. That pushes hardware costs to $900 or more before installation, but what you get is genuinely impressive: 1-second resolution measurements, 0.5% accuracy (better than most utility meters), and no subscription fee.
For integrators building energy monitoring into a Control4, Savant, or Crestron-based system where real-time local data feeds automation logic, Iotawatt is often the right answer. It doesn’t have a polished consumer app, but that’s not its purpose.
Schneider Electric Square D Energy Center
For new construction or major panel upgrades, Schneider Electric’s Square D Energy Center combines a smart breaker panel with integrated current monitoring. Individual smart breakers can be individually controlled and monitored remotely. The 200A 42-circuit panel costs $900 to $1,200 in hardware, with installation running $1,500 to $3,000 depending on complexity.
This is the cleanest approach architecturally: monitoring is built into the panel from the start, no secondary sensors, no cramped panel with added CTs. The Square D Home app provides remote breaker control, circuit-level energy data, and load balancing for EV charging. The tradeoff is vendor lock-in and the cost and disruption of a panel replacement.
Integration With Smart Home Platforms
Energy monitoring data becomes genuinely powerful when it feeds into a broader automation system. Standalone apps are useful; automation that acts on energy data is transformative.
Home Assistant has native integrations for Emporia Vue 2, Sense, Iotawatt, and Shelly energy-monitoring plugs. You can build automations that shift EV charging to off-peak hours, alert when a circuit draws unexpected current (helpful for appliance fault detection), or display real-time consumption on a dashboard alongside other sensor data.
Control4 and Savant both support energy monitoring drivers, though the implementation depends on the specific monitoring hardware. An integrator building a full smart home climate control system will often pull Iotawatt or Emporia data into the platform via custom drivers or Home Assistant as a middleware layer. The value here is unified control: a single interface where the homeowner adjusts HVAC, lighting, and sees energy consumption together.
Crestron supports energy management through its EnergyLink product line for commercial applications and through third-party integrations at the residential level. Larger residential projects with Crestron control often use a dedicated energy management panel with structured CT monitoring rather than consumer-grade solutions.
Lutron doesn’t have native energy monitoring, but occupancy sensor data from a Lutron RadioRA 3 or HomeWorks system can feed into automation logic that reduces consumption by shutting off lighting and HVAC in unoccupied zones. That’s a different approach, using presence data rather than consumption data, but it achieves complementary results.
If you’re integrating energy monitoring with smart thermostats from Nest, ecobee, or a professional HVAC control platform, you can create feedback loops where the thermostat adjusts setpoints based on real-time consumption data or utility pricing signals.
Solar and Battery Integration
Energy monitoring takes on a different character once you add solar panels or a home battery. The question shifts from “how much am I consuming?” to “how much am I consuming, how much am I producing, how much am I exporting, and how do I optimize the balance?”
Most solar inverter manufacturers include monitoring as part of their platforms. Enphase IQ System Controller, SolarEdge Energy Hub, and Tesla Powerwall all provide production and consumption data through their apps. But these are siloed systems, and getting that data into a unified smart home platform often requires additional integration work.
For homeowners with solar, the Emporia Vue 2 is worth special consideration because Emporia sells a dedicated solar monitoring configuration with CT sensors for both service conductors and solar production conductors, giving you net production, consumption, and grid import/export in one app. The Solar and Smart Home Integration guide covers this architecture in more depth, but the short version is that whole-home energy monitoring is essentially required infrastructure once you have solar, because without it you’re flying blind on whether you’re actually achieving the economics you planned.
Time-of-use rate plans from utilities add another layer of value to monitoring. If your utility charges 38 cents per kWh from 4 PM to 9 PM and 12 cents overnight, knowing which loads can shift to off-peak hours is worth real money. A standard 7.2 kW EV charger running 8 hours nightly during peak hours costs roughly $21.50 at 38 cents. Shifted to off-peak, the same charge costs $6.90. Energy monitoring makes that arbitrage visible and automation makes it effortless.
Circuit-Level Monitoring: What to Prioritize
Not every circuit needs dedicated monitoring. In a 42-circuit panel, roughly 10 to 15 circuits account for 80 to 90 percent of total consumption. Prioritizing those circuits gets you most of the insight at a fraction of the sensor cost.
The circuits worth monitoring first:
HVAC systems. A 3-ton heat pump pulls 3,000 to 5,000 watts during heating and cooling cycles. Monitoring the compressor circuit and air handler separately tells you how hard the system is working and alerts you to abnormal draw patterns that might signal a refrigerant issue or failing capacitor. If you’re considering zoned HVAC with smart dampers, per-zone runtime data combined with circuit monitoring creates a complete picture of thermal performance.
Water heater. A 4,500-watt electric resistance element is one of the highest-draw appliances in most homes, running one to three hours per day. Heat pump water heaters draw less (roughly 500 to 1,000 watts in heat pump mode), but their compressor cycling is still worth tracking. Monitoring this circuit often reveals the water heater is the second or third largest energy consumer in the home, behind HVAC.
EV charger. Level 2 EVSE units pull 7.2 kW to 19.2 kW depending on the charger and vehicle. This is a significant load, and knowing when and how long it runs is useful both for energy budgeting and for load management with solar and battery systems.
Kitchen circuits. Dishwashers, electric ranges, and refrigerators each have distinctive consumption profiles worth tracking. A refrigerator that’s running its compressor 70 percent of the time instead of the expected 30 to 40 percent may have a door seal problem or be undersized for its ambient temperature.
Dryer. A 5,600-watt electric dryer is among the highest-draw appliances in the home. Monitoring this circuit also helps flag lint buildup: a dryer with restricted airflow runs longer cycles to achieve the same drying result, which shows up as extended high-wattage draw periods.
Indoor Air Quality Monitoring vs Energy Monitoring
One category that sometimes gets conflated with energy monitoring is environmental sensor monitoring: temperature, humidity, CO2, and particulate levels. These serve complementary purposes but are fundamentally different systems. A smart HVAC filter system with air quality monitoring tracks what’s in the air; energy monitoring tracks what’s powering the equipment conditioning that air. Both have value, and in a well-designed smart home they feed into each other: air quality data might trigger increased ventilation cycles, and energy monitoring helps you understand the cost of running that ventilation at different intensities.
Installation Realities
Every energy monitoring system that uses CT sensors requires panel access, which means licensed electrician work in most jurisdictions. The sensors themselves don’t interrupt circuits, but installing them in a live panel requires working in proximity to energized conductors.
A typical Emporia Vue 2 installation runs $150 to $300 in labor for a straightforward 20-circuit deployment. Iotawatt installs with multiple units take longer and can run $400 to $600 in labor for a fully monitored 42-circuit panel. Square D Energy Center panel replacements involve a full panel swap and typically require a permit, inspection, and 8 to 12 hours of electrician time, pushing total installed costs to $3,500 to $6,000.
For homes with a Schneider Electric, Siemens, or Leviton load center already, adding CT monitoring is straightforward if there’s physical space in the panel. Older panels that are already crowded make CT installation harder. An electrician may recommend a subpanel or panel upgrade before adding monitoring hardware.
What to Do With the Data
Collecting energy data and doing nothing with it is a common failure mode. The monitoring is there, the app has charts, but consumption doesn’t change. Getting value out of energy monitoring requires translating data into action.
The most effective use pattern:
-
Establish a baseline. Run monitoring for 30 days without changing behavior. Note which circuits are the largest consumers and when peak consumption occurs.
-
Identify anomalies. A circuit drawing 3 watts continuously when the relevant appliance is supposedly off might be a vampire load. A motor that starts pulling 20 percent more watts than its baseline might be failing.
-
Set alerts. Configure notifications for circuits that exceed thresholds. A water heater running for 90 consecutive minutes is unusual and worth investigating.
-
Build automations. Use consumption data to trigger actions: shift dishwasher and laundry to off-peak hours, curtail EV charging when whole-home consumption hits a threshold that risks utility demand charges, or feed data to a control platform that adjusts HVAC setpoints during grid peak events.
-
Track changes. After adding insulation, replacing an aging HVAC system, or switching from electric resistance to a heat pump water heater, monitoring provides the before-and-after data to quantify the improvement.
For homes with radiant floor heating, energy monitoring is particularly useful because radiant systems often run during pre-dawn hours and their consumption is invisible in daily life. Monitoring reveals how much energy your floor is consuming across different thermostat setpoints and outdoor temperatures, which helps optimize schedules significantly.
Choosing the Right System for Your Home
The right choice depends primarily on what you want to know and how you’ll use the data.
If you want a simple baseline with appliance detection and don’t mind some imprecision, Sense at $299 plus installation is a reasonable starting point. The app is good, the integration list is broad, and setup is relatively painless.
If you want accurate per-circuit data at a reasonable price and are comfortable with a modest amount of configuration, Emporia Vue 2 is the best value in the category. The $139.99 hub plus sensor cost makes it accessible, and Home Assistant integration is mature.
If you’re building a high-performance smart home with Control4, Savant, or a serious Home Assistant deployment, and you want local processing with open data access and maximum accuracy, Iotawatt is the professional-grade choice despite its higher upfront cost and steeper setup curve.
If you’re in new construction or planning a panel upgrade, the Schneider Electric Square D Energy Center offers the cleanest integrated solution, though at a premium that only makes sense when a new panel is already in the budget.
One thing worth noting: the energy monitoring category is evolving quickly. Utility companies in California, Texas, and the Northeast are rolling out time-of-use rates to more customers, which increases the financial stakes of knowing when you use power, not just how much. As EV adoption grows and more homes add batteries and solar, the complexity of home energy management increases in ways that make granular monitoring increasingly valuable rather than optional.
The Actual Payoff
A whole-home energy monitoring system with per-circuit coverage typically costs $200 to $600 installed for a DIY-friendly approach, or $1,500 to $4,000 for a professionally integrated solution in a complex installation. The payoff comes in three forms: behavioral savings from visibility, operational savings from automation, and diagnostic value when equipment problems emerge.
For a home spending $250 per month on electricity, a 10 percent reduction saves $300 annually. A 15 percent reduction saves $450. The monitoring system pays for itself in one to two years in those scenarios, and the data continues generating value for the life of the equipment.
The homeowners who get the most from energy monitoring are the ones who treat it as infrastructure rather than a gadget: install it once, integrate it with the broader smart home system, and let the data drive continuous improvement over time rather than reviewing it occasionally as a curiosity.